

The health policies implemented by U.S. presidents have significantly influenced the nation's healthcare landscape over the years. With Donald Trump in his second term, we’ve examined how his first term compared to some of his most recent predecessors.
To do so, we’ve compared each recent president on various health-related factors, such as life expectancy, death rates, and the cost of prescription drugs.For each factor, we took an average across every year of each presidency and calculated how this compared to the president before them.
Presidents ranked by healthcare changes
To determine which presidents had the most significant impact on healthcare, we compared their terms to those of their predecessors in terms of percentage differences across key health indicators, as averages across their tenures. The rankings below show their overall influence on healthcare compared to the president before them.
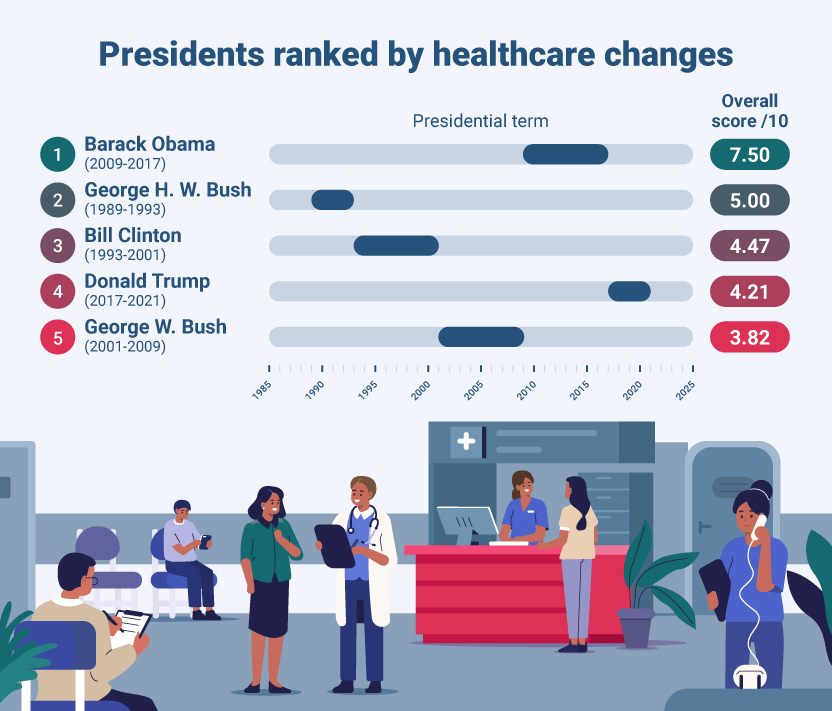
- Barack Obama (2009-2017) - Score: 7.50
According to the data, Obama saw the most substantial positive impact on healthcare, with life expectancy rising by 2% and preventable death rates decreasing by 5%. The most notable changes included a 22% decline in heart disease deaths and a 13% drop in diabetes deaths - two of the leading causes of death in the US - making these reductions particularly significant. Additionally, Medicaid coverage increased by 45%, expanding access to healthcare for millions. His administration also achieved a 9% reduction in uninsured individuals under 65, mainly due to the Affordable Care Act (Obamacare), which left a lasting legacy in US healthcare by expanding coverage and reforming the system. - George H. W. Bush (1989-1993) - Score: 5.00
Bush Sr. also saw improvements, with a 10% drop in preventable deaths and a 15% decline in heart disease mortality. However, he experienced a significant rise (18%) in diabetes-related fatalities and an increase in uninsured individuals (8%). - Bill Clinton (1993-2001) - Score: 4.47
Clinton continued some of Bush Sr.’s positive trends, with a 3% reduction in preventable deaths and an 11% drop in heart disease deaths. His administration saw a 39% rise in Medicaid coverage, but uninsured rates also increased. - Donald Trump (2017-2021) - Score: 4.21
Trump’s presidency saw mixed results. While uninsured rates fell significantly by 26%, the preventable death rate rose sharply by 25%, and drug- and alcohol-related deaths surged by 47%. Heart disease and diabetes deaths saw modest increases while healthcare costs continued rising. - George W. Bush (2001-2009) - Score: 3.82
Bush Jr. oversaw a 22% drop in heart disease deaths, but preventable deaths increased by 10%, and out-of-pocket healthcare costs surged by 27%. Medicaid coverage expanded by 28%, but uninsured rates remained essentially unchanged.
As you can see, recent presidents have had varied impacts on healthcare outcomes. Obama had the most positive influence, with significant improvements in insurance coverage, heart disease mortality, and diabetes-related deaths.
On the other hand, Trump’s first term saw a sharp rise in preventable deaths and substance-related fatalities despite some progress in reducing uninsured rates. While healthcare advancements continued across administrations, challenges like rising costs, obesity, and drug-related deaths have remained issues for each president.
Healthcare progress by factor
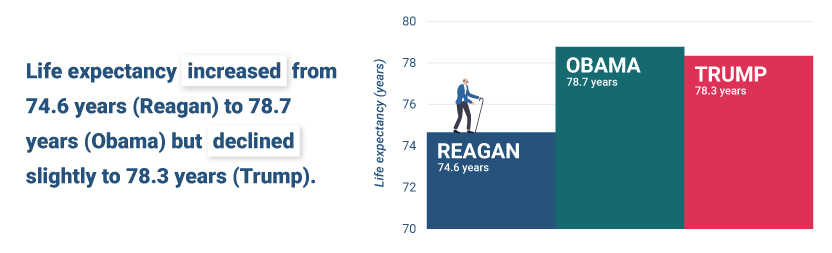
- Life expectancy gradually increased from 74.6 years under Ronald Reagan to a peak of 78.7 years under Barack Obama but declined slightly under Donald Trump to 78.3 years.
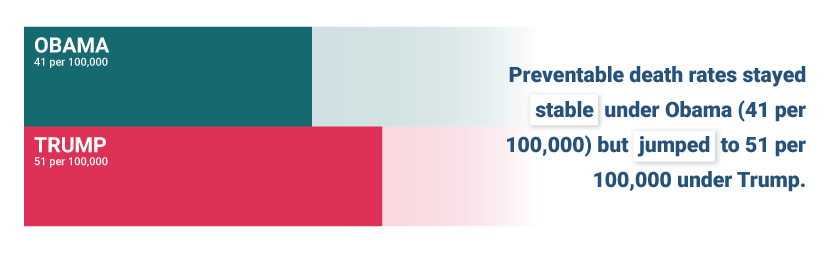
- Preventable death rates remained relatively stable but saw a significant jump under Trump, rising from 41 per 100,000 people under Obama to 51 during Trump’s first term as president.
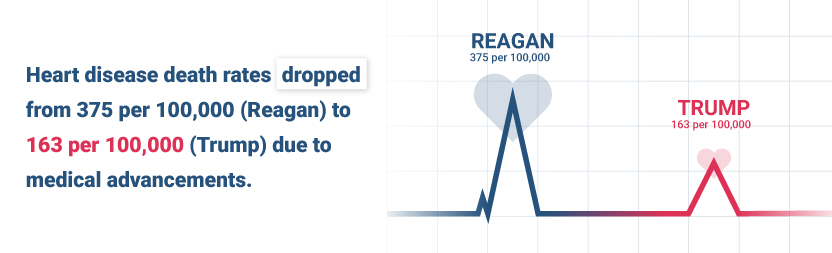
- Heart disease death rates declined consistently, from 375 per 100,000 under Reagan to 163 under Trump, reflecting advancements in medical treatment and prevention.
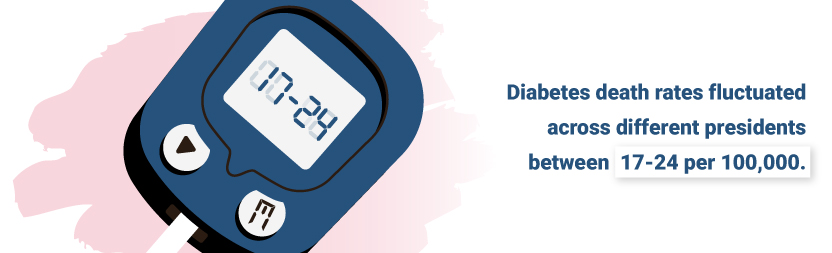
- Diabetes death rates fluctuated across different presidents but remained within the range of 17-24 per 100,000 people. This may be due to improved diabetes management, including the increasing use of injectable GLP-1 treatments, which were available for diabetes before their wider adoption for obesity.
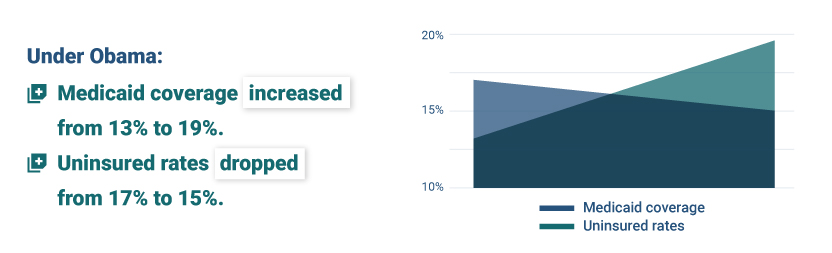
- Health insurance coverage saw significant shifts, particularly under Obama, with Medicaid coverage rising from 13% to 19% and uninsured rates falling from 17% to 15%.
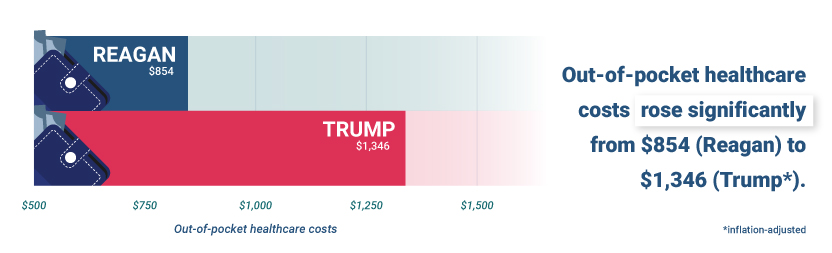
- Out-of-pocket healthcare costs rose significantly, from $854 under Reagan to $1,346 under Trump (inflation-adjusted).
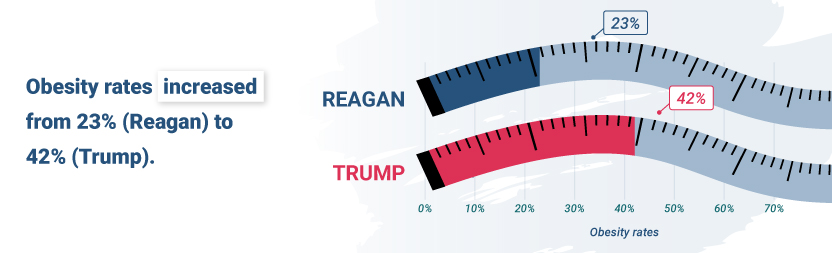
- Obesity rates steadily increased, from 23% under Reagan to 42% under Trump.
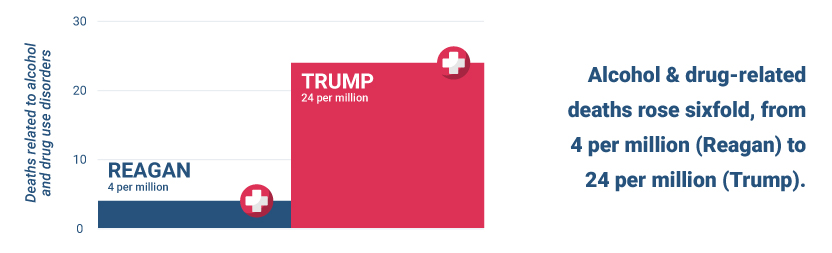
- Deaths related to alcohol and drug use disorders surged, increasing sixfold from four per million under Reagan to 24 per million under Trump.
Methodology
Data was sourced for the following factors for every year that data was available, from Ronald Reagan to Donald Trump’s first term.
- Life expectancy: the United Nations’ World Population Prospects 2024
- Preventable death rate: NSC Injury Facts’ Historical Preventable Fatality Trends
- Heart disease death rate: the National Center for Health Statistics Health, United States data
- Diabetes mellitus death rates: the National Center for Health Statistics Health, United States data
- People under 65 with no health insurance: the National Center for Health Statistics Health, United States data
- Medicaid coverage among people under 65: the National Center for Health Statistics Health, United States data
- Medicare beneficiaries
- 2013 and earlier: CMS.gov Medicare Enrollment - National Trends 1966-2013
- Post-2013: CMS.gov Medicare Monthly Enrollment
- Hospital beds per 1,000 people: World Bank
- Out-of-pocket healthcare costs (inflation-adjusted): Peterson-KFF’s Health System Tracker
- Retail rx drug spending (inflation-adjusted): Peterson-KFF’s Health System Tracker
- Obesity rates: the National Center for Health Statistics Prevalence of Overweight, Obesity, and Severe Obesity Among Adults Aged 20 and Over: United States, 1960–1962 Through 2017–2018
- Deaths related to alcohol and drug use disorders: Our World in Data
We took an average across each president’s entire tenure for each factor and calculated the difference compared to the previous president. Based on the differences, we calculated a normalized score out of ten.


