Insurance vs Salary

The cost of health insurance by state revealed
With the inflation of healthcare costs and shortages of prescription drugs, there’s no denying that the cost of living crisis has brought about many challenges. However, regarding each state’s health insurance coverage compared to their average salary, which states are the most affected?
We looked at the average cost of healthcare insurance coverage and the states with the highest and lowest average salaries to see where people are most likely to afford healthcare.
We also look on a global scale to reveal the countries that spend the highest amount on
healthcare per person and those that offer the best average annual salaries, to determine
the most and least affordable countries.
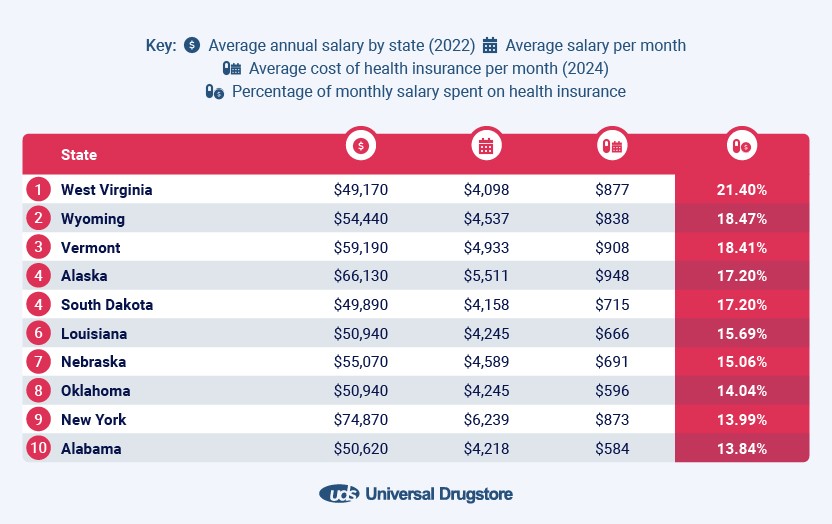
States spending the most of their salaries on health insurance per month
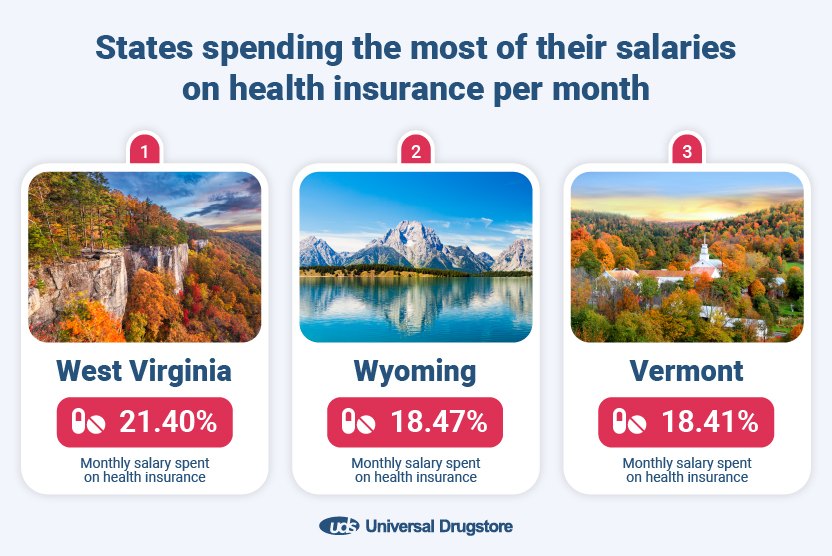
- West Virginia
Monthly salary spent on health insurance: 21.40%Due to a rise in low-wage industries, West Virginia has one of the lowest average annual salaries ($49,170) and a lower cost of living than other states. Despite lower living costs, the Eastern state spends the most on health insurance per month, with residents estimated to spend as much as 21.4% of their monthly income on healthcare coverage.
- Wyoming
Monthly salary spent on health insurance: 18.47%With 18.47% of the average monthly salary spent on health insurance, Wyoming ranks second with one of the most expensive insurance-to-salary ratios. Although the state’s average yearly wage ($54,440) is relatively lower than in other states, it has the fifth highest cost of health insurance per month, with health coverage costing $838 on average.
- Vermont
Monthly salary spent on health insurance: 18.41%Health insurance in Vermont is considerably higher than in others. The state has the second highest cost for health insurance expenses, averaging a whopping $908 per month. With an average yearly salary of $59,190, residents spend 18.41% of their monthly wages on health insurance coverage.
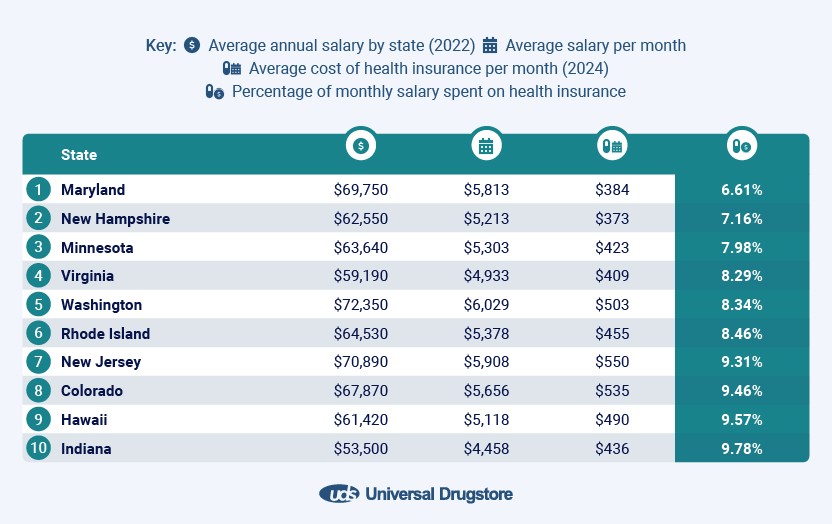
States spending the least of their salaries on health insurance per month
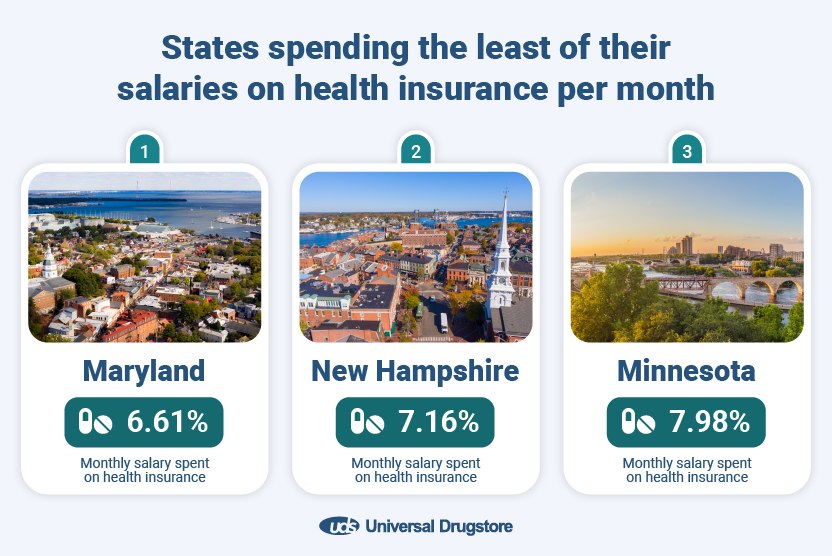
- Maryland
Monthly salary spent on health insurance: 6.61%Maryland is the state that spends the least on health insurance per month, with residents spending just 6.61% of their monthly income on healthcare coverage. The Mid-Atlantic state is one of the top ten highest-paying states, with an average annual wage of $69,750 while having the second-lowest monthly cost for health insurance of just $384.
- New Hampshire
Monthly salary spent on health insurance: 7.16%New Hampshire follows behind, with 7.16% of the average monthly salary spent on health insurance. Though a small state, New Hampshire sustains an average yearly salary of $62,550 while having the cheapest health insurance coverage of $373 per month, the most affordable in any state.
- Minnesota
Monthly salary spent on health insurance: 7.98%The yearly average wage in New Hampshire is $63,640, while health insurance expenses cost an average of $423 monthly. Around 7.98% of the average monthly salary is spent on health insurance. Minnesota also helps low-income residents through its Medicaid program to provide access to affordable healthcare coverage.
States with the most expensive health insurance
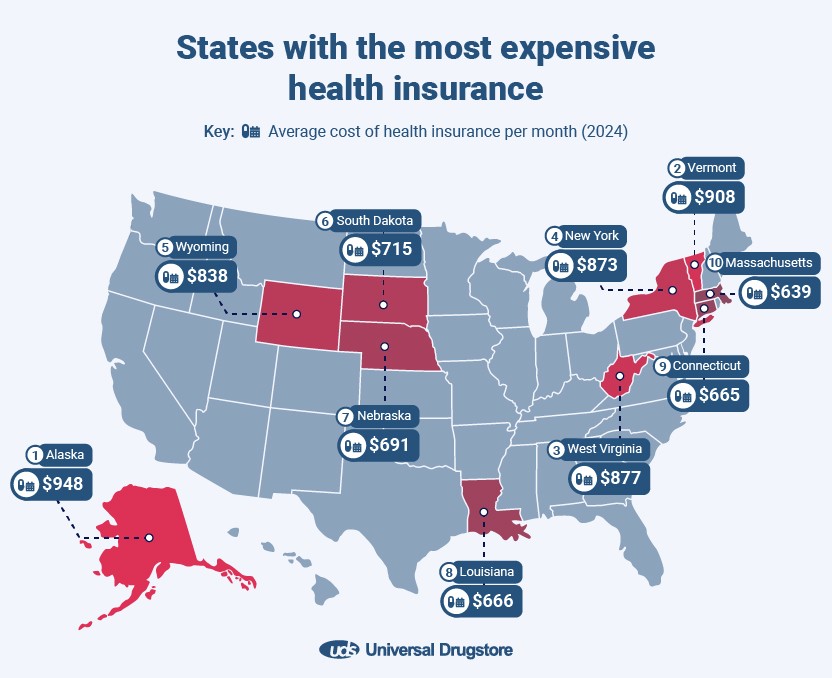
- Alaska
Average cost of health insurance per month: $948Alaska tops the list with the most expensive health insurance, with an average cost of $948 per month. Due to Alaska’s relatively small population, there is a limited number of medical providers and services compared to larger states. As a result, the competition among providers is also restricted, especially for specialty physicians, which could explain why healthcare insurance is notably higher in Alaska than in other states.
- Vermont
Average cost of health insurance per month: $908Vermont is ranked second place, with health insurance expenses reaching as high as $908 on average per month. Research suggests that the state’s health insurance premiums have risen due to hospitals seeking to recover their budgets after the pandemic. The spike comes after the Green Mountain Care Board approved insurance rate increases for the state’s largest insurance companies. (1)
- West Virginia
Average cost of health insurance per month: $877West Virginia is among the top three most expensive states, with the average health insurance costing $877 per month. The Mountain State has seen a significant increase in insurance rates, resulting in changes in the state Legislature amid years of financial struggles.
However, West Virginia also offers an Affordable Care Act (ACA) in response to the rising insurance costs. This saw a record-hitting 21.3 million enrolments in 2024, the single largest change in ACA enrollment of any state from 2023-24. (2)
States with the most affordable health insurance
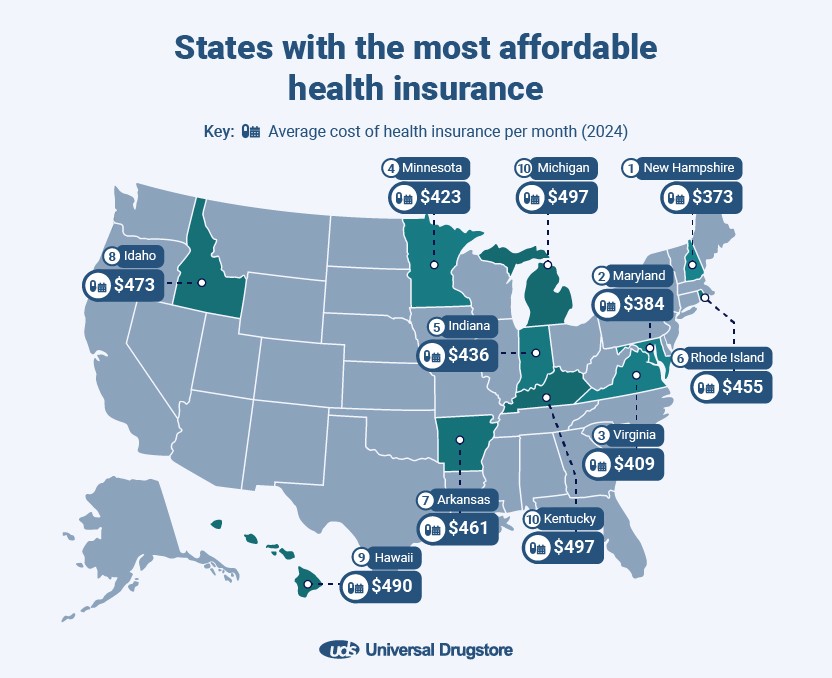
- New Hampshire
Average cost of health insurance per month: $373New Hampshire has the most affordable health insurance, costing an average of $373 monthly. Much like in West Virginia, New Hampshire has also implemented the ACA, which provides residents with essential benefits, Medicaid expansion, and federal subsidies for eligible people. The impact of the ACA has led to improved health coverage. Insurance providers also can not deny individuals due to any pre-existing conditions.
- Maryland
Average cost of health insurance per month: $384Maryland is the second most affordable state, with an average cost of $384 per month for health insurance. In 2019, the state established a reinsurance program, meaning full-price (unsubsidized) insurance premiums were kept lower than they would have been otherwise. Maryland also provides an easy enrollment program, enabling residents to apply for health coverage through their state tax return. (3)
- Virginia
Average cost of health insurance per month: $409In third place is Virginia, with average monthly health insurance expenses costing $409.
Unlike neighbouring West Virginia, which has a higher percentage of older adults and individuals with chronic health conditions, leading to potentially higher premiums, Virginia doesn’t drive up its insurance costs significantly.
Although Virginia does not offer free health insurance to residents, it provides several programs and resources to help individuals and families access affordable insurance coverage. These include the Children’s Health Insurance Program (CHIP), Medicaid, and subsidies available through the Health Insurance Marketplace.
States with the highest increase in health insurance rates
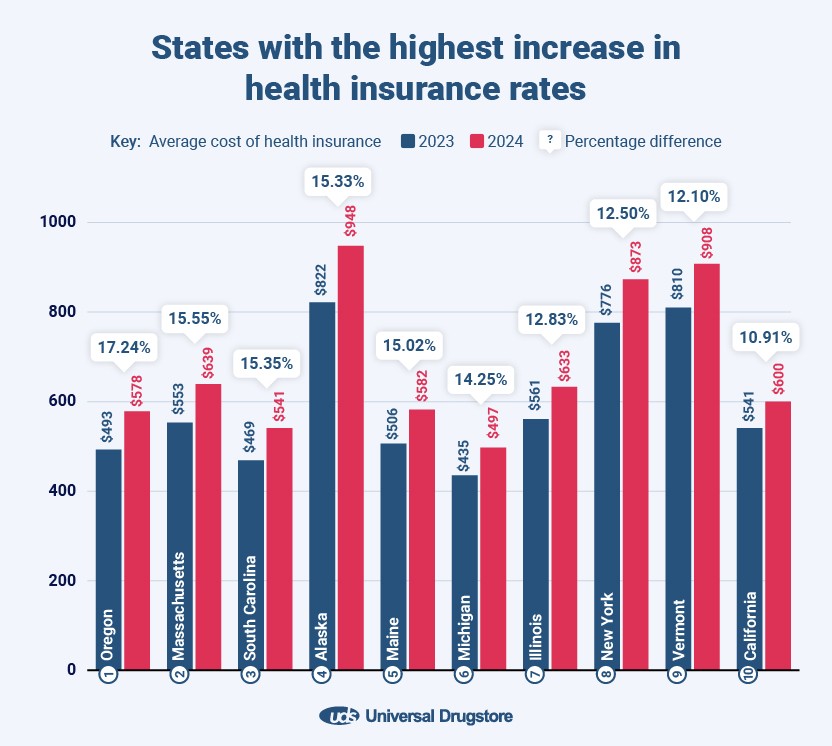
- Oregon
Difference in health insurance costs per month: 17.24%Oregon has seen a substantial increase in healthcare costs, from an average of $493 to $578 by 2024, showcasing an increase of 17.24% in one year. With faster-growing healthcare expenses than any other state, since 2019, many Oregonians have delayed receiving healthcare due to rising costs. This results from the spike in health expenses, especially with the pandemic causing staffing shortages. (4)
- Massachusetts
Difference in health insurance costs per month: 15.55%The rising healthcare costs in Massachusetts have led to state residents facing affordability challenges. This double-sided problem has meant that the cost of care is being pushed out of reach for many while also draining the pockets of others. This, coupled with profitability being down across various hospitals across the state, has led to an increase of 15.55% in health insurance costs.
- South Carolina
Difference in health insurance costs per month: 15.35%South Carolina has also seen an increase of just over 15% in health insurance costs. The average cost of health insurance was $469, soaring to $541 in 2024.
Despite the increase in health insurance rates, the state is gradually making strides to improve its health services. For example, in 2022, the Inflation Reduction Act (5) was introduced in the state to help lower healthcare costs by capping prescription drug prices, reducing health insurance premiums, and expanding Medicaid to help decrease uncompensated care costs. (6)
States with the highest decrease in health insurance rates
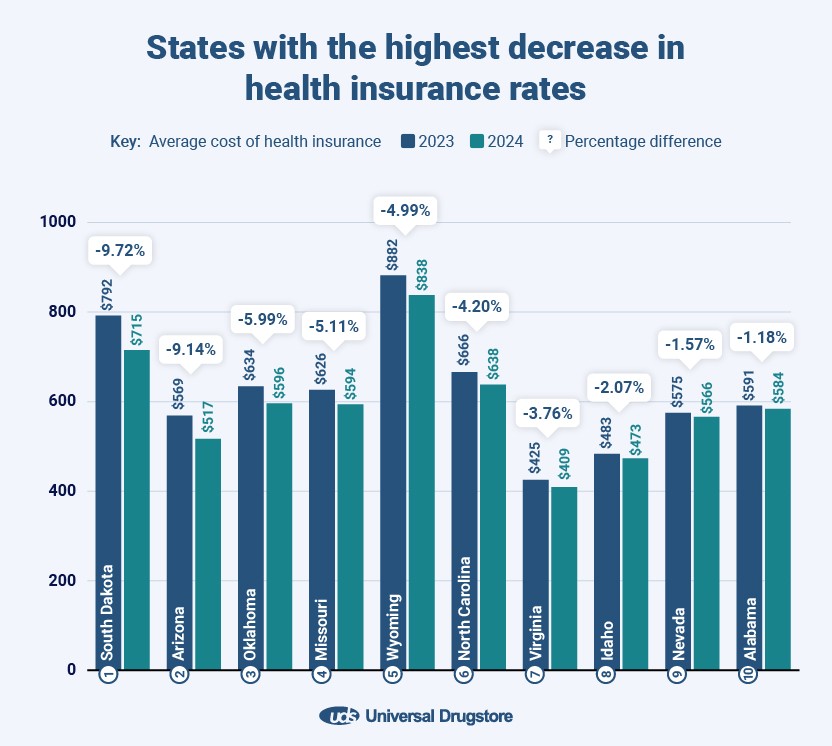
- South Dakota
Difference in health insurance costs per month: -9.72%South Dakota tops the list as the state has decreased the most in health insurance rates, with nearly a 10% decrease over the last year. The midwestern state had an average cost of $792 for health insurance in 2023, but by 2024, this was down by $77, making it one of the few states decreasing healthcare expenses.
- Arizona
Difference in health insurance costs per month: -9.14%Next is Arizona, which experienced a 9.14% decrease from 2023 to 2024. The southwestern state offers various plans catering to residents’ healthcare needs and budgets. Tax credits and subsidies are also available to eligible residents to help make insurance more affordable. As a result, Arizona’s health insurance cost is generally lower than the national average ($560).
- Oklahoma
Difference in health insurance costs per month: -5.99%Oklahoma ranks third with almost a 6% decrease in health insurance rates. Situated in the South Central region of the US, the landlocked state offers cost-sharing reductions (CSR) that aid in reducing out-of-pocket costs for those who are eligible. According to research, in 2023, around 96% of Oklahoma Marketplace enrollees were receiving CSR benefits. (7)
Countries with the highest health expenses
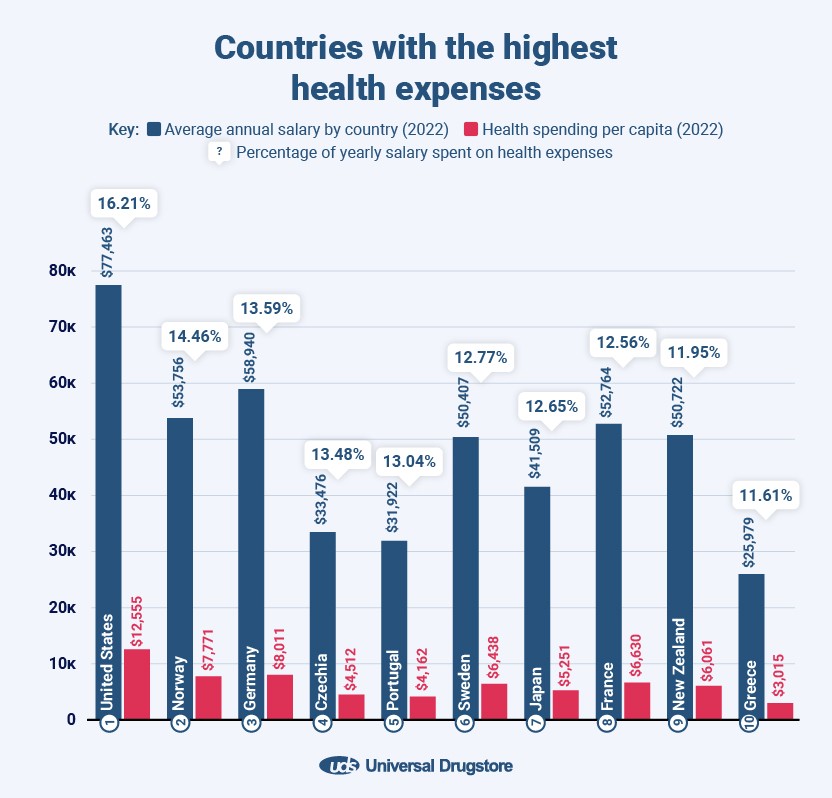
- United States
Yearly salary spent on health: 16.21%The United States is among the top three highest-paid countries, with an average annual salary of $77,463. However, an estimated $12,555 per person is spent on healthcare yearly, far more than any other country. As a result, around 16.21% of the average annual salary is used for health expenses.
- Norway
Yearly salary spent on health: 14.46%Just over 14% of the average yearly wages in Norway is spent on health expenses, making it the second-highest spender on our list. The Scandinavian country offers an average salary of $53,756 annually while investing an average of $7,771 in healthcare per person yearly.
- Germany
Yearly salary spent on health: 13.59%Often regarded as having one of the best healthcare systems in the world, it is no surprise that the nation also spends a considerable amount on health. On average, 13.59% of German residents’ yearly salary ($58,940) goes towards health expenses.
Countries with the lowest health expenses
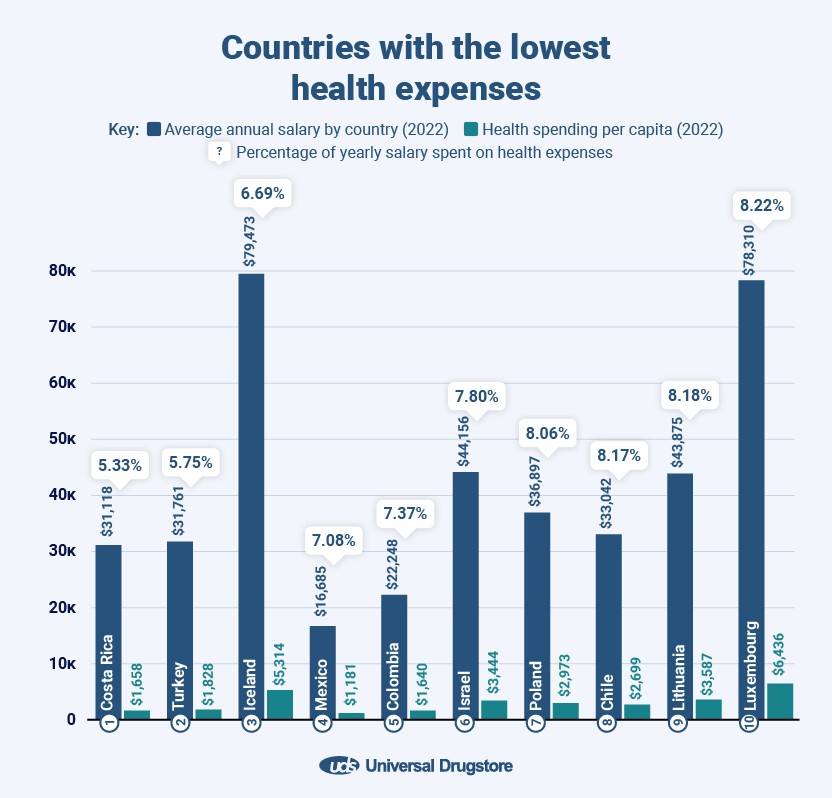
- Costa Rica
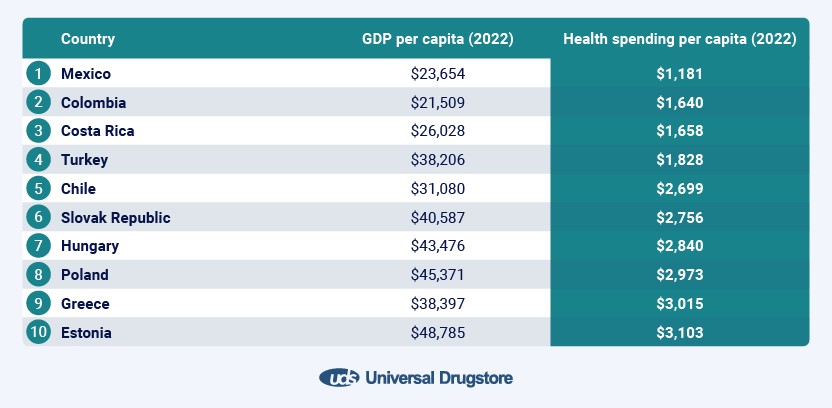
Yearly salary spent on health expenses: 5.33%Costa Rica spends the least on healthcare in relation to its yearly average wages. The country is in the top ten countries with the lowest annual salary ($31,118) and is ranked third for investing the least in health spending per capita ($1,658). As a result, just 5.33% of the average yearly wages are spent on health expenses.
- Turkey
Yearly salary spent on health expenses: 5.75%Known to have quite an affordable and accessible healthcare system, 5.75% of Turkey’s average annual salary of $31,761 is designated towards health expenses. However, Turkey is one of the lowest investors in terms of health spending per capita, with an average of $1,828, the fourth lowest among any other OECD country.
- Iceland
Yearly salary spent on health expenses: 6.69%Iceland offers the highest average annual salary of any other OECD country, with a yearly wage of $79,473. The country’s ability to provide high salaries comes from its private-sector banking. Interestingly, despite having such a high average salary and a GDP per capita of $71,84, Iceland’s population spends just $5,314 on healthcare per person, meaning 6.69% of the average yearly wage is spent on health expenses.
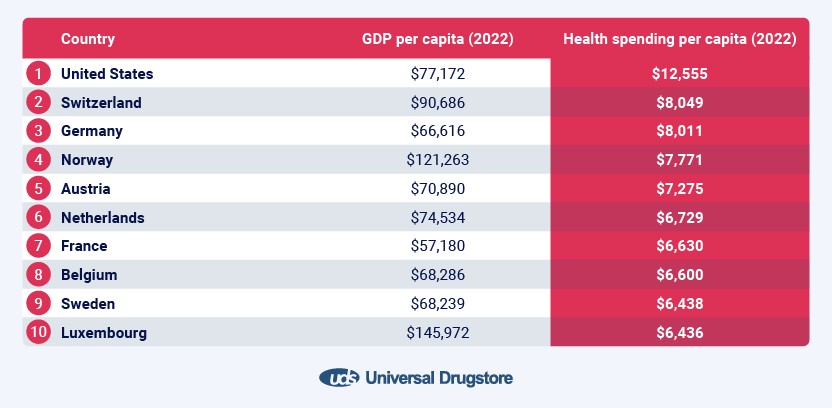
Countries spending the most on healthcare
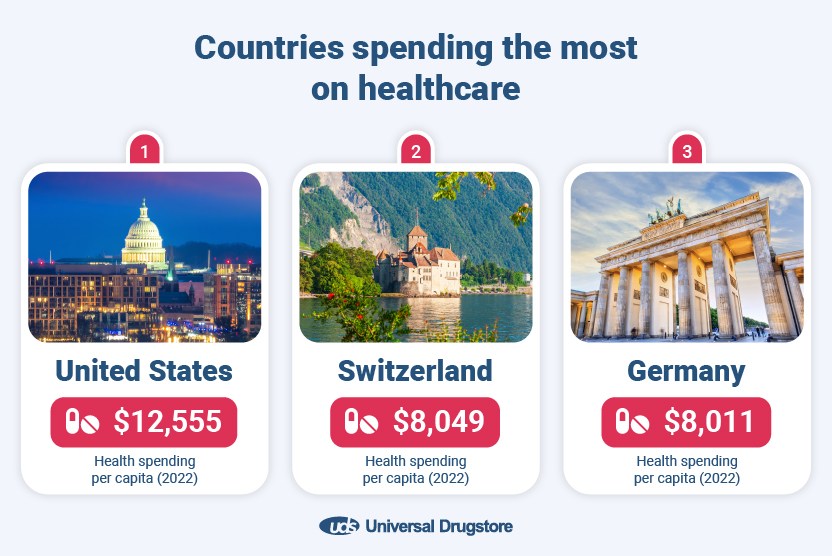
- United States
Health Spending Per Capita: $12,555The United States spends the most on healthcare, with an average spend of $12,555 per person; this is over $4,000 more than any other high-income country and nearly double the average of all OECD countries, which is $6,651. Additionally, the per capita health spending saw a growth of 2.9% in 2022 compared to 2021. (8)
- Switzerland
Health Spending Per Capita: $8,049Switzerland has the second-highest spending per capita on healthcare, costing $8,049 on average. Known to be considerably more expensive than other European countries, Switzerland also fosters a high average yearly salary of $72,993, which means that healthcare spending is also relatively high, having seen a 6.2% increase from 2021-2022.
- Germany
Health Spending Per Capita: $8,011Not too far behind in Germany, with a health spending of $8,011 per capita. Despite having a much lower GDP per capita compared to Switzerland, both countries have very similar spending on average per person. Compared to 2021, Germany has seen a 6.6% increase in health spending by 2022.
Countries spending the least on healthcare
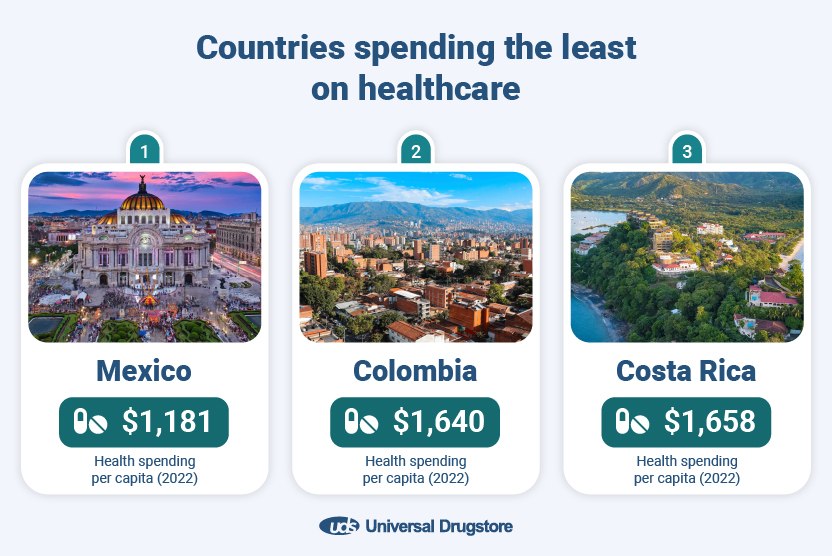
- Mexico
Health Spending Per Capita: $1,181Mexico spends the least on healthcare, with an average health spending of $1,181 per capita. Having the least investment in the health sector means that Mexico spends significantly less (82%) than the OECD average.
- Colombia
Health Spending Per Capita: $1,640Colombia also has very low healthcare spending of $1,640. Although its GDP per capita is slightly lower ($21,509) than Mexico’s ($23,654), Columbia’s investment in health spending is approximately 39% higher on average per person.
- Costa Rica
Health Spending Per Capita: $1,658In third place is Costa Rica, with an average health spending of $1,658 per person as of 2022. Compared to Mexico and Colombia, Costa Rica has a higher GDP of $26,028 per capita. In relation to the country’s investment in healthcare, it also has a slightly higher yearly wage of $31,118.
Methodology:
To gather data on the average cost of health insurance by state, we used ValuePenguin to source how much health insurance costs in each US state and the percentage difference from 2023-24.
Please note the average cost for each state was calculated based on the monthly policy premium for a 40-year-old on a Silver Plan.
Using the U.S. Bureau of Labour Statistics, we then sourced the occupational wage estimates for each state as of May 2022, noting the annual mean wage for all occupations and ranking them in order.
To calculate the percentage of the monthly salary spent on health insurance, we decided the annual average wages by 12 to get the monthly wages. This was then used to work out the percentage of spent on healthcare. This data was updated on 03/19/2024.
To determine health spending for each of the 38 OECD countries, we used the average health expenditure per capita from 2022, sourced from the Health System Tracker.
The average salary for each OECD country was sourced from OECD Data, which shows the average annual wages for 2022. This was then ranked in order.
Using the average annual salary by country and calculating this by each country’s health spending per capita, we calculated the percentage of the yearly wage spent on health expenses, which was then ranked to find the most and least affordable countries. This data was updated on 03/19.2024.
Please note that all data was collected on 03/14/2024 using the above sources unless otherwise stated.
References:
- https://www.vermontpublic.org/local-news/2023-08-08/vermonts-health-insurance-premiums-will-rise-hospitals-seek-recovery-budgets
- https://wvmetronews.com/2024/01/29/west-virginia-sees-single-largest-increase-in-aca-marketplace-enrollments-during-open-enrollment-period/
- https://www.healthinsurance.org/states/health-insurance-maryland/
- https://eu.statesmanjournal.com/story/news/health/2023/05/05/oregonians-delay-health-care-due-high-costs-inflation-covid-pandemic/70177427007/
- https://www.whitehouse.gov/wp-content/uploads/2022/08/South-Carolina-Health-Care.pdf
- https://www.ncbi.nlm.nih.gov/pmc/articles/PMC10767419/
- https://www.cms.gov/files/document/early-2023-and-full-year-2022-effectuated-enrollment-report.pdf
- https://www.healthsystemtracker.org/chart-collection/health-spending-u-s-compare-countries/#Per%20capita%20health%20expenditures,%20U.S.%20dollars,%20PPP%20adjusted,%202021%20and%202022%C2%A0